The ceiling
How well could anything predict this system? The ceiling, and the figure from the paper.
| Who it is for | You want to reproduce or check the paper's figure, or you want to know what “good” means before measuring anything |
| Prerequisites | The idea of a scoring rule. No paper required — the golden values are printed |
| Runs on | pip install ppsds alone |
Six numbers you can check by hand
python examples/understand_predictability/quickstart.py # about two seconds
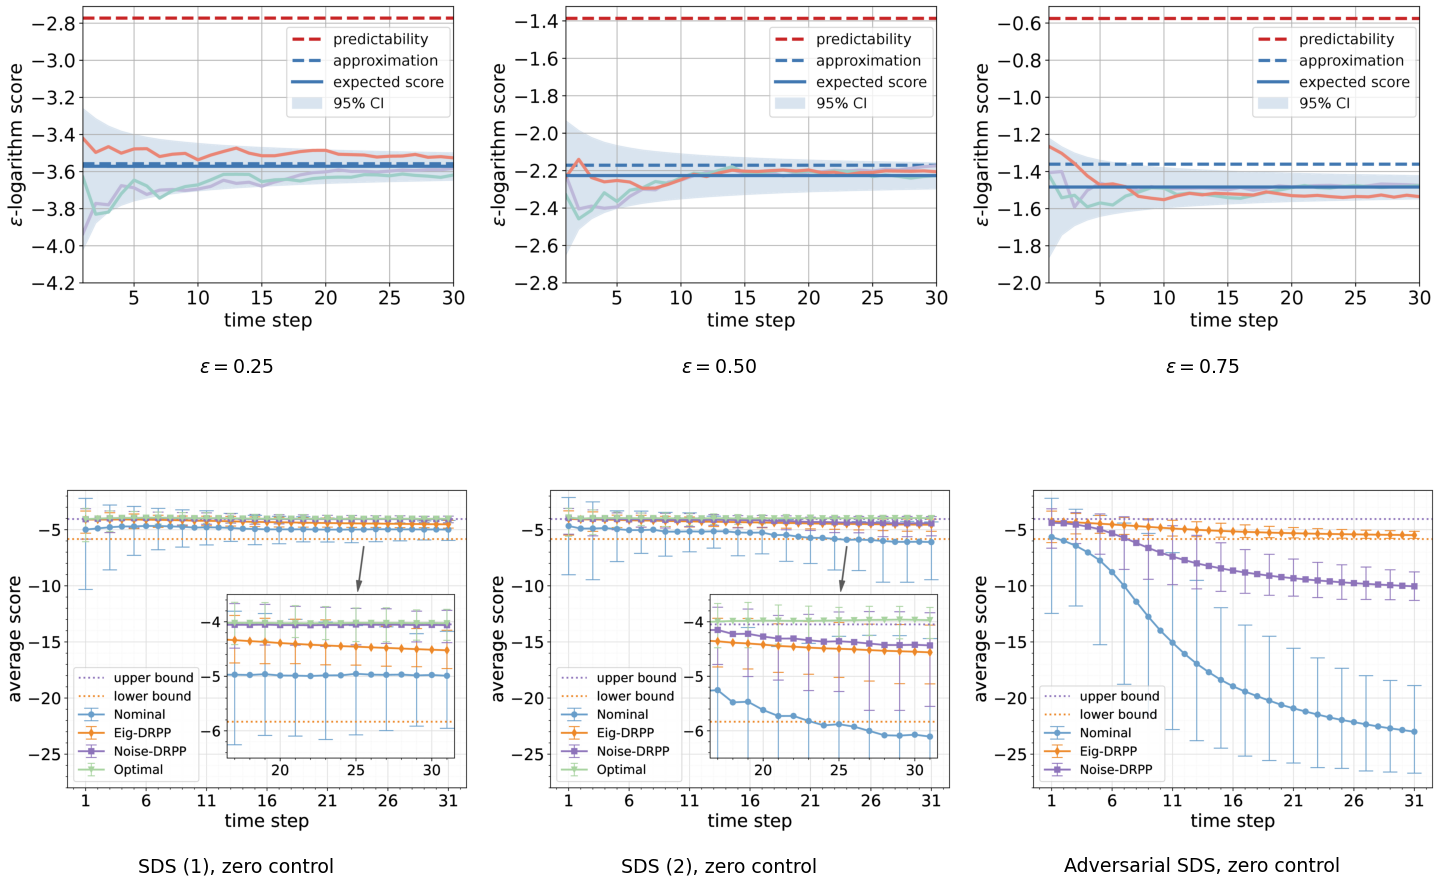
The system is a shear x_{k+1} = A x_k + w_k with uniform noise, T = 30. The script prints the
noise's differential entropy and the cross-entropy against the predictor, then compares three
quantities at three radii:
Reference values, from the laws (not from samples):
  differential entropy of the noise   h_d(q)    = +1.38629
  cross-entropy against the predictor H(q || p) = +2.17123

eps    predictability approximation     measured      |err|  |err|/eps
----------------------------------------------------------------------------
0.25       -2.77259     -3.55752     -3.57173    0.01421    0.05683
0.5        -1.38629     -2.17123     -2.22676    0.05553    0.11107
0.75       -0.57536     -1.36030     -1.48379    0.12349    0.16466
What to conclude: the predictability column is a property of the system, not of any
predictor: no predictor is involved in computing it, and nothing can beat it. The approximation
column is where the paper says this predictor should land, up to an error of order epsilon. The
measured column tracks it, and the error grows with epsilon exactly as the paper reports.
Two things reviewers ask about, both visible here:
- The gap between the two lines is the price of misspecification, not evidence of a bad implementation. The predictor is a diagonal Gaussian; the true noise is uniform.
- The two lines do not meet at
epsilon = 0. The score is discontinuous there: at exactlyepsilon = 0it islog p(x), while for anyepsilon > 0it carries ad_x * log(2 epsilon)volume term. Neither line is a limit of the other.
The paper's figure, at the paper's scale
The predictability experiment runs the same system over 100,000 trajectories and writes the three-panel figure, at the resolution the paper uses. It takes seconds rather than minutes — the whole point of this side of the package is that it is cheap, because it never solves an optimization problem.
Next
- The derivation and the evaluation recipe: the predictability paper
- The same thing at paper scale: the predictability experiment
- The other side of the question: what “worst case” means
- Put a predictor on your own system: Getting Started